By Alan Hoffman, April 15, 2021
In part one of this series, I discussed the role of Advanced Urban Visioning in helping cities and regions achieve better outcomes from their investments in transportation infrastructure. In this follow-up, I look at issues facing planners in northern California as they attempt to optimize their different transportation networks, and I suggest how to improve the projected outcomes of such efforts.
Advanced Urban Visioning is a set of techniques aimed at identifying a compelling vision of what a region wants to become. It inverts the traditional “order of planning” by beginning with transit networks, then bicycle networks, then public space and the pedestrian realm, and only then the automobile. It asks, for each network, what would maximize the usefulness of that network for the largest share of the public and elaborates a staging strategy to produce an ideal system within budgetary and political constraints.
Three key strategies can be applied to transit networks:
- Network Structure. Identify and link a region’s principal nodes as directly as possible. Maximize the ability of people to travel among these nodes and surrounding origins and destinations.
- System Performance. Systematically slash travel time and wait time.
- Customer Experience. Re-design the customer experience to maximize convenience, minimize perceived risk, and delight users.
What do people want?
Market research helps highlight the relative value that people give to the different dimensions of a service offering. Deep market studies conducted in various US cities have found that the customer base for transit is not monolithic; rather it comprises people with different needs and values. A study by Harris Interactive for the Metro Atlanta region classified people into four groups based on openness or interest in transit. Two transit-friendly groups represented nearly two-thirds of the metro population. To capture those transit-friendly segments, we need to understand their needs, which, from the research, can be reduced to:
“Take me from where I am to where I’m going, do it quickly with minimal waiting, and make me feel good about the experience.”
Indeed, market research has uncovered relevant factors that transit planners may not be considering and certainly are not reflected in regional travel models. Planners interested in maximizing ridership on new transit projects should pay special attention to three factors:
1, Walking. People are willing to walk farther between their origin (home) and a transit station than from a station to their destination. Though planners often use a half-mile radius as the “transit walk-shed,” this distance may be most appropriate to the trip origin. Robert Cervero found that the effective radius at the destination or work-end of a trip is perhaps a sixth of a mile, and the share of people willing to walk a quarter-mile is half the number of those willing to walk that sixth of a mile.
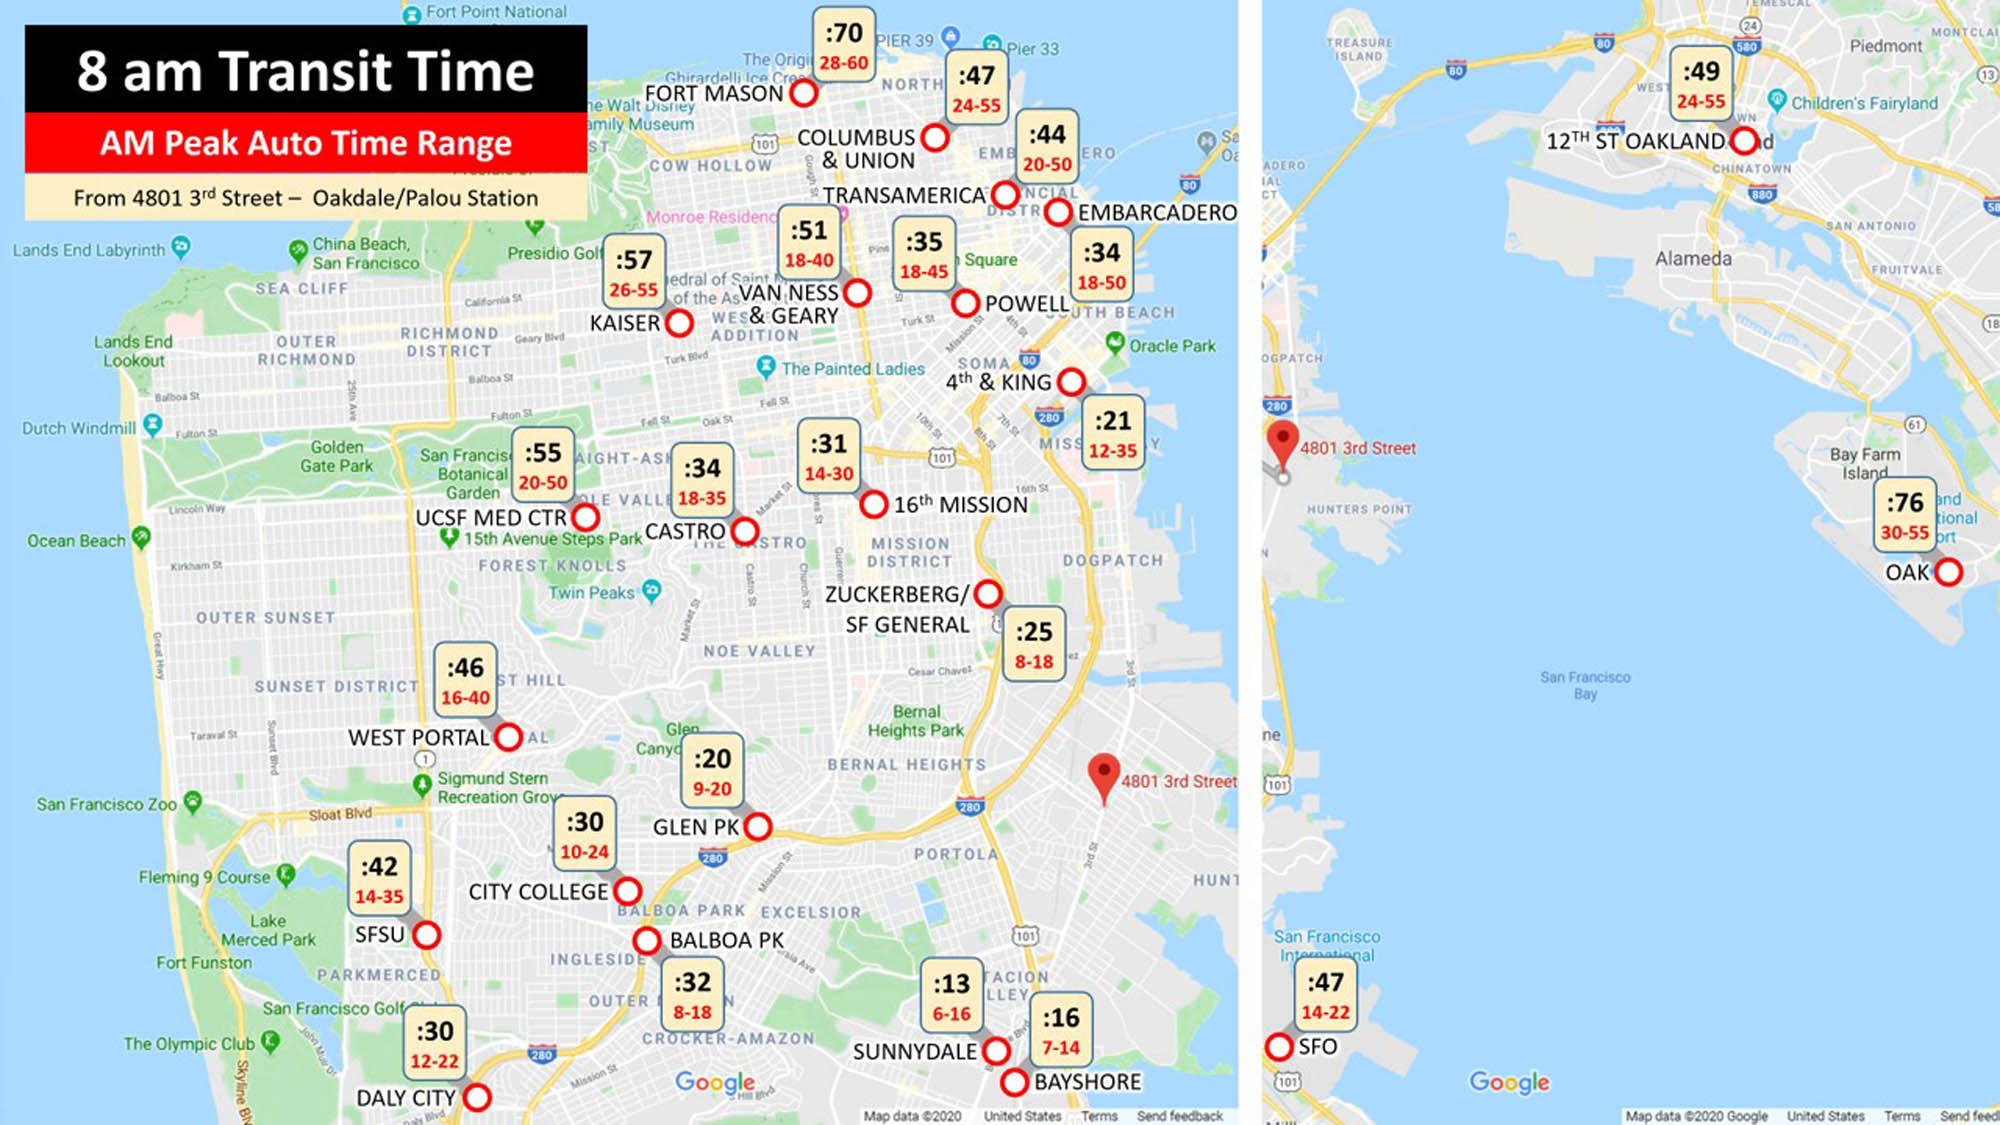
2, Door-to-door travel time is a key factor for many people, but it doesn’t drive the planning/design process. When the forerunner of San Diego’s MTS opened a light-rail extension to Old Town in the 1990s, planners re-routed express buses to Old Town instead of Downtown, thinking they were doing riders a favor. But most of these riders quit transit, as their trips now were 20 minutes longer because of the transfer.
3, Station design. The broader market for transit is looking for three principal attributes when it comes to station design and functioning: protection from the elements (sun, wind, and rain), protection from moving vehicles, and protection from other people. Yet we still design and build transit stations as if people’s preferences don’t matter.
That people’s preferences matter is critical. Transit is one of the few public services that actually competes for business. Most people have a choice as to how they will get to their destinations. Appeals to the public to “do the right thing” by riding transit only go so far if transit takes longer than driving, if stations/stops are inconveniently located, or if the experience is stressful. Hence the importance of asking, “What does a truly effective transit system look like?” When the attractive pull of transit is maximized, it not only shapes transportation patterns but land use patterns as well. As Robert Cervero demonstrated, the more effectively a transit system serves a metro area as it is, the more effectively it can shape the future growth of that region.
The modeling challenge
Analytical tools for regions need to measure and properly account for truly optimized systems. Most regional agencies maintain detailed regional travel models that are computer simulations of how people get around and the tradeoffs they make when considering travel modes. The models are generally designed to test responsiveness to modest or incremental changes in a transportation network, but they are weak at understanding consumer response to very different networks or systems.
In the Bay Area, the Metropolitan Transportation Commission (MTC) maintains a Regional Travel Model to project ridership by mode of proposed transportation projects. As this model helps determine which projects get funded and which don’t, it’s imperative that the model accurately reflects what we know about consumer behavior. Otherwise, projects that could make a real-world difference in shifting people from automobiles may fail a modeling test because the model doesn’t actually measure what the project is doing.
Funding a more robust model
This is through no fault of MTC and its modeling staff; quite the contrary. MTC’s modelers have been very diligent and responsive, but they’re also underfunded. It is in the Bay Area’s best interests to fund a more robust modeling section.
If regional leadership chooses to increase financial and staff support for modeling, these programmatic goals can guide the effort:
- Support the transition to new modeling tools. Bay Area modelers have worked to develop a more robust regional model, but they need more staff.
- Incorporate market segmentation. Not all people share the same values. Market segmentation can help identify who is most likely to respond to different aspects of service. Segmentation can prevent costly mistakes and better identify which services are viable where.
- Better understand walking. While the regional model accounts for the walking environment, it does not differentiate between the origin and destination ends of a trip. The differences should be explored and incorporated into the model.
- Better measure walking distance. Few if any regional travel models actually measure the walking distance to/from stations. They assign an average walk distance to all origins or destinations within a “Transportation Analysis Zone,” or TAZ, of which there are 1454 in the 7-county Bay Area. And as Cervero found (see above), small distances can make a major difference in transit uptake. Current models, however, will show that a transit plan that “nails” such micro-distances would perform identically to one that places stations far more inconveniently.
- Better account for station environment and micro-location. Market research shows that many people are far more willing to use transit if it involves waiting at a well-designed station (as compared to a typical bus stop on the side of a busy road).
- Incorporate comparative door-to-door travel times. No US model I know includes comparative door-to-door travel time (alternative mode vs. driving), yet research has continually demonstrated the importance of overall trip time to potential users of competing modes. Any regional travel model needs to include this measure.
Incorporating these six concerns into regional travel modeling would help the Bay Area identify and fund a more effective set of transit projects, with major implications for other travel modes — and plans for land use and housing.
Conclusion
Advanced Urban Visioning, built on inverting the order of planning, is a clear process that combines a deep understanding of what drives consumer choice with techniques to design transportation networks that maximize benefits for any given level of public investment. Once modeling tools reflect these insights, projects that truly achieve long-range goals are more likely to make it through the planning, funding, and implementation process.
 Alan Hoffman is a founding fellow of the Center for Advanced Urban Visioning and an Equity Consultant to the Oregon Department of Transportation. He has consulted to the SFCTA on transit planning for the Bayshore community and developed TransForm’s Bay Area Regional Express Transit Proposal (ReX) for MTC. Hoffman holds an MS in planning from MIT, a master’s in administration, planning, and social policy from Harvard, and a BA in social relations from Cornell. He is the author of Sails to Trails: Reimaging San Diego’s Historic Growth Corridor, and the Federal Transit Administration’s Advanced Network Planning for Bus Rapid Transit. He resides in Walnut Creek. You can reach him at [email protected].