By Dhawal Kataria, AICP, January 19, 2022
Even when the transportation of students and staff is carefully considered in locating schools, unforeseen changes in land use and demographics can upset the best of plans.
Slow population growth, Covid- and economy-delayed marriages, and urban out-migration have resulted in a decline in school enrollment in many communities. The Hayward Unified School District (HUSD), with a roughly 20 percent decline in enrollment from 2000 to 2021, is no different from others across the state. HUSD has projected a further 13 percent decline in enrollment over the next six years. The resulting reduction in revenue is pressuring the school district to consider consolidating 14 schools in the coming years.
The school district has developed a comprehensive Operational Sustainability Report to better utilize resources and facilities. Its recommendations are based on data and feedback received over the past three years through community town halls, various district committees, the development of a strategic plan, and from facilities and financial data. Although the Operational Sustainability Report initially included “transportation impacts and implications” as a criterion for school site selection, it was determined to be too complicated to measure.
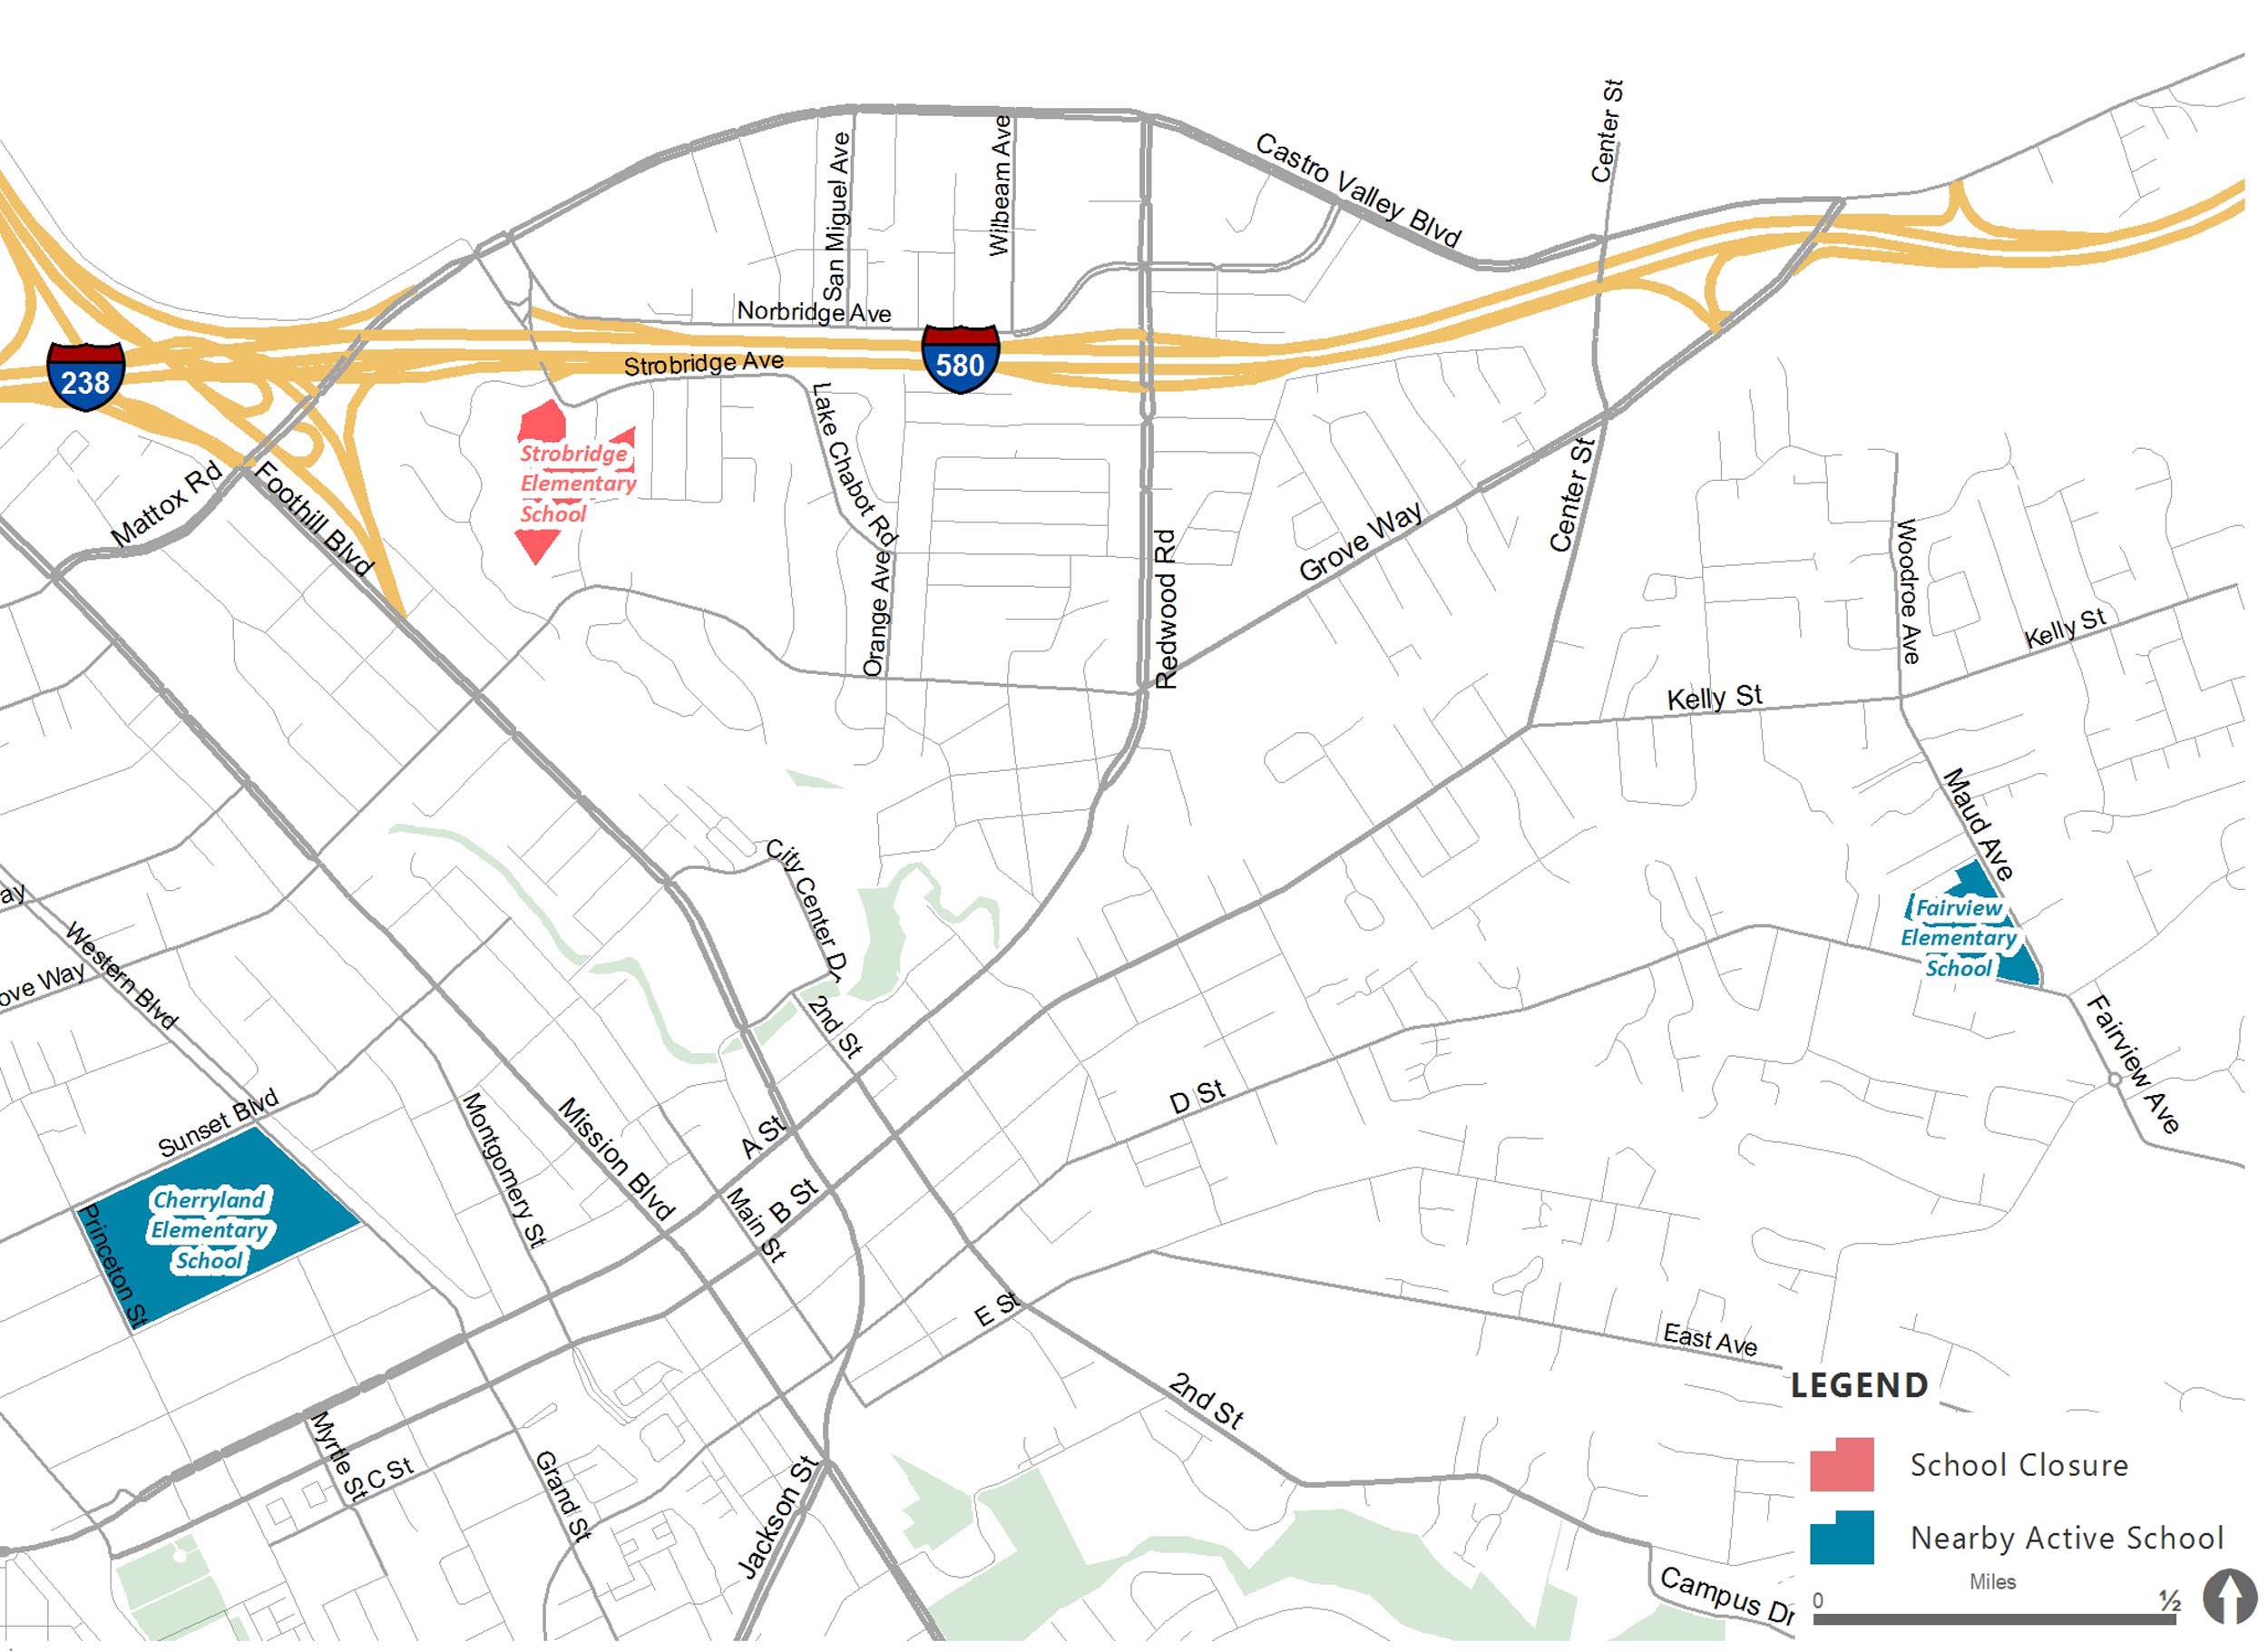
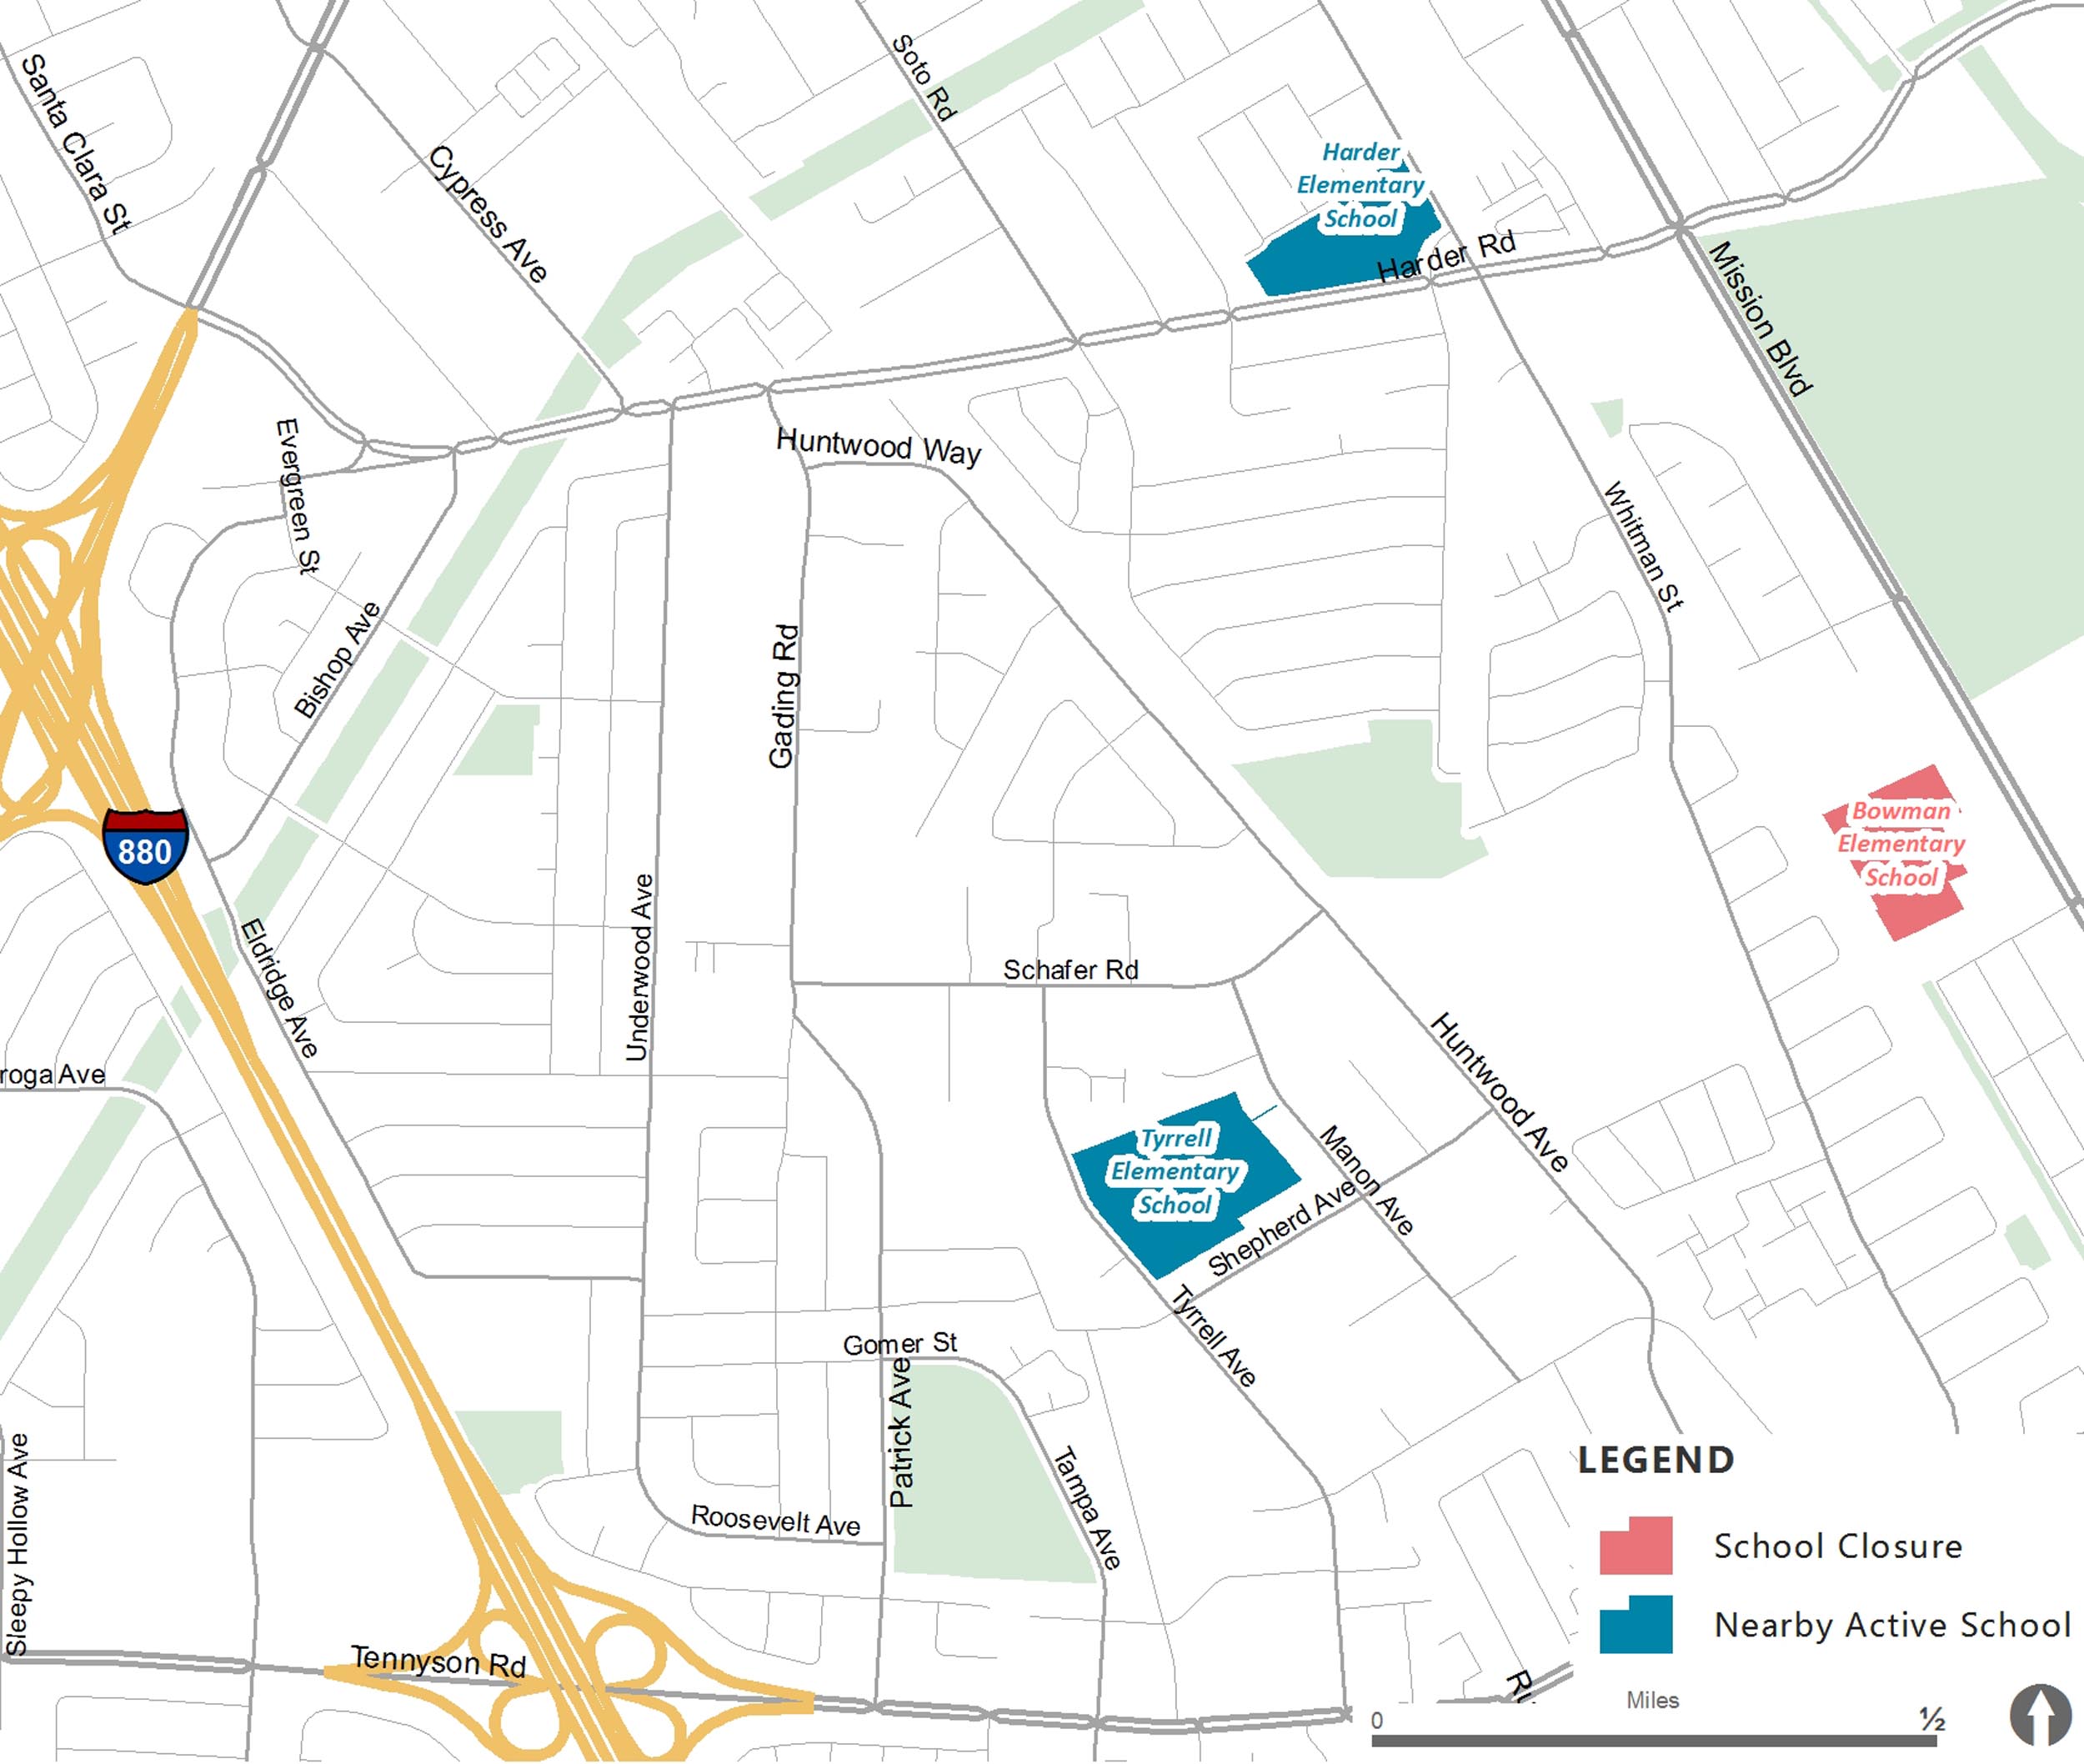
This past November, the school district decided to shut two elementary schools (Strobridge and Bowman) by the 2022-2023 school year. The two schools selected for closure have a combined enrollment of about 650 students. The students displaced from the two schools are expected to enroll in one of four open schools nearby, but given the distances between the new schools and the enrollment areas of the closed schools, the transferred students will be unlikely to walk or bicycle to school. Instead, these students will most likely be driven to school, adding traffic and straining available parking at the open elementary schools and their main streets. Parents who have been walking their children to the four receiving schools may also feel uncomfortable because of the increased traffic, which would undermine the effectiveness of the Safe Route to School Program (SR2S) as these parents begin driving to school.
Two maps — north and south — show locations of receiving schools and those to be closed. Source: HUSD
According to Brian McComb, Principal at Southgate Elementary School, “More students would create more congestion, more parking needs, [and] longer arrival and dismissal times. More congestion creates a higher chance of parent frustration and may lead to speeding around campus.”
Schools are not typically designed for high vehicular traffic volumes. In general, roughly 40 percent of students are expected to arrive other than by car. Most traffic issues at schools relate to congestion before and after school when parents are dropping off and picking up their children.
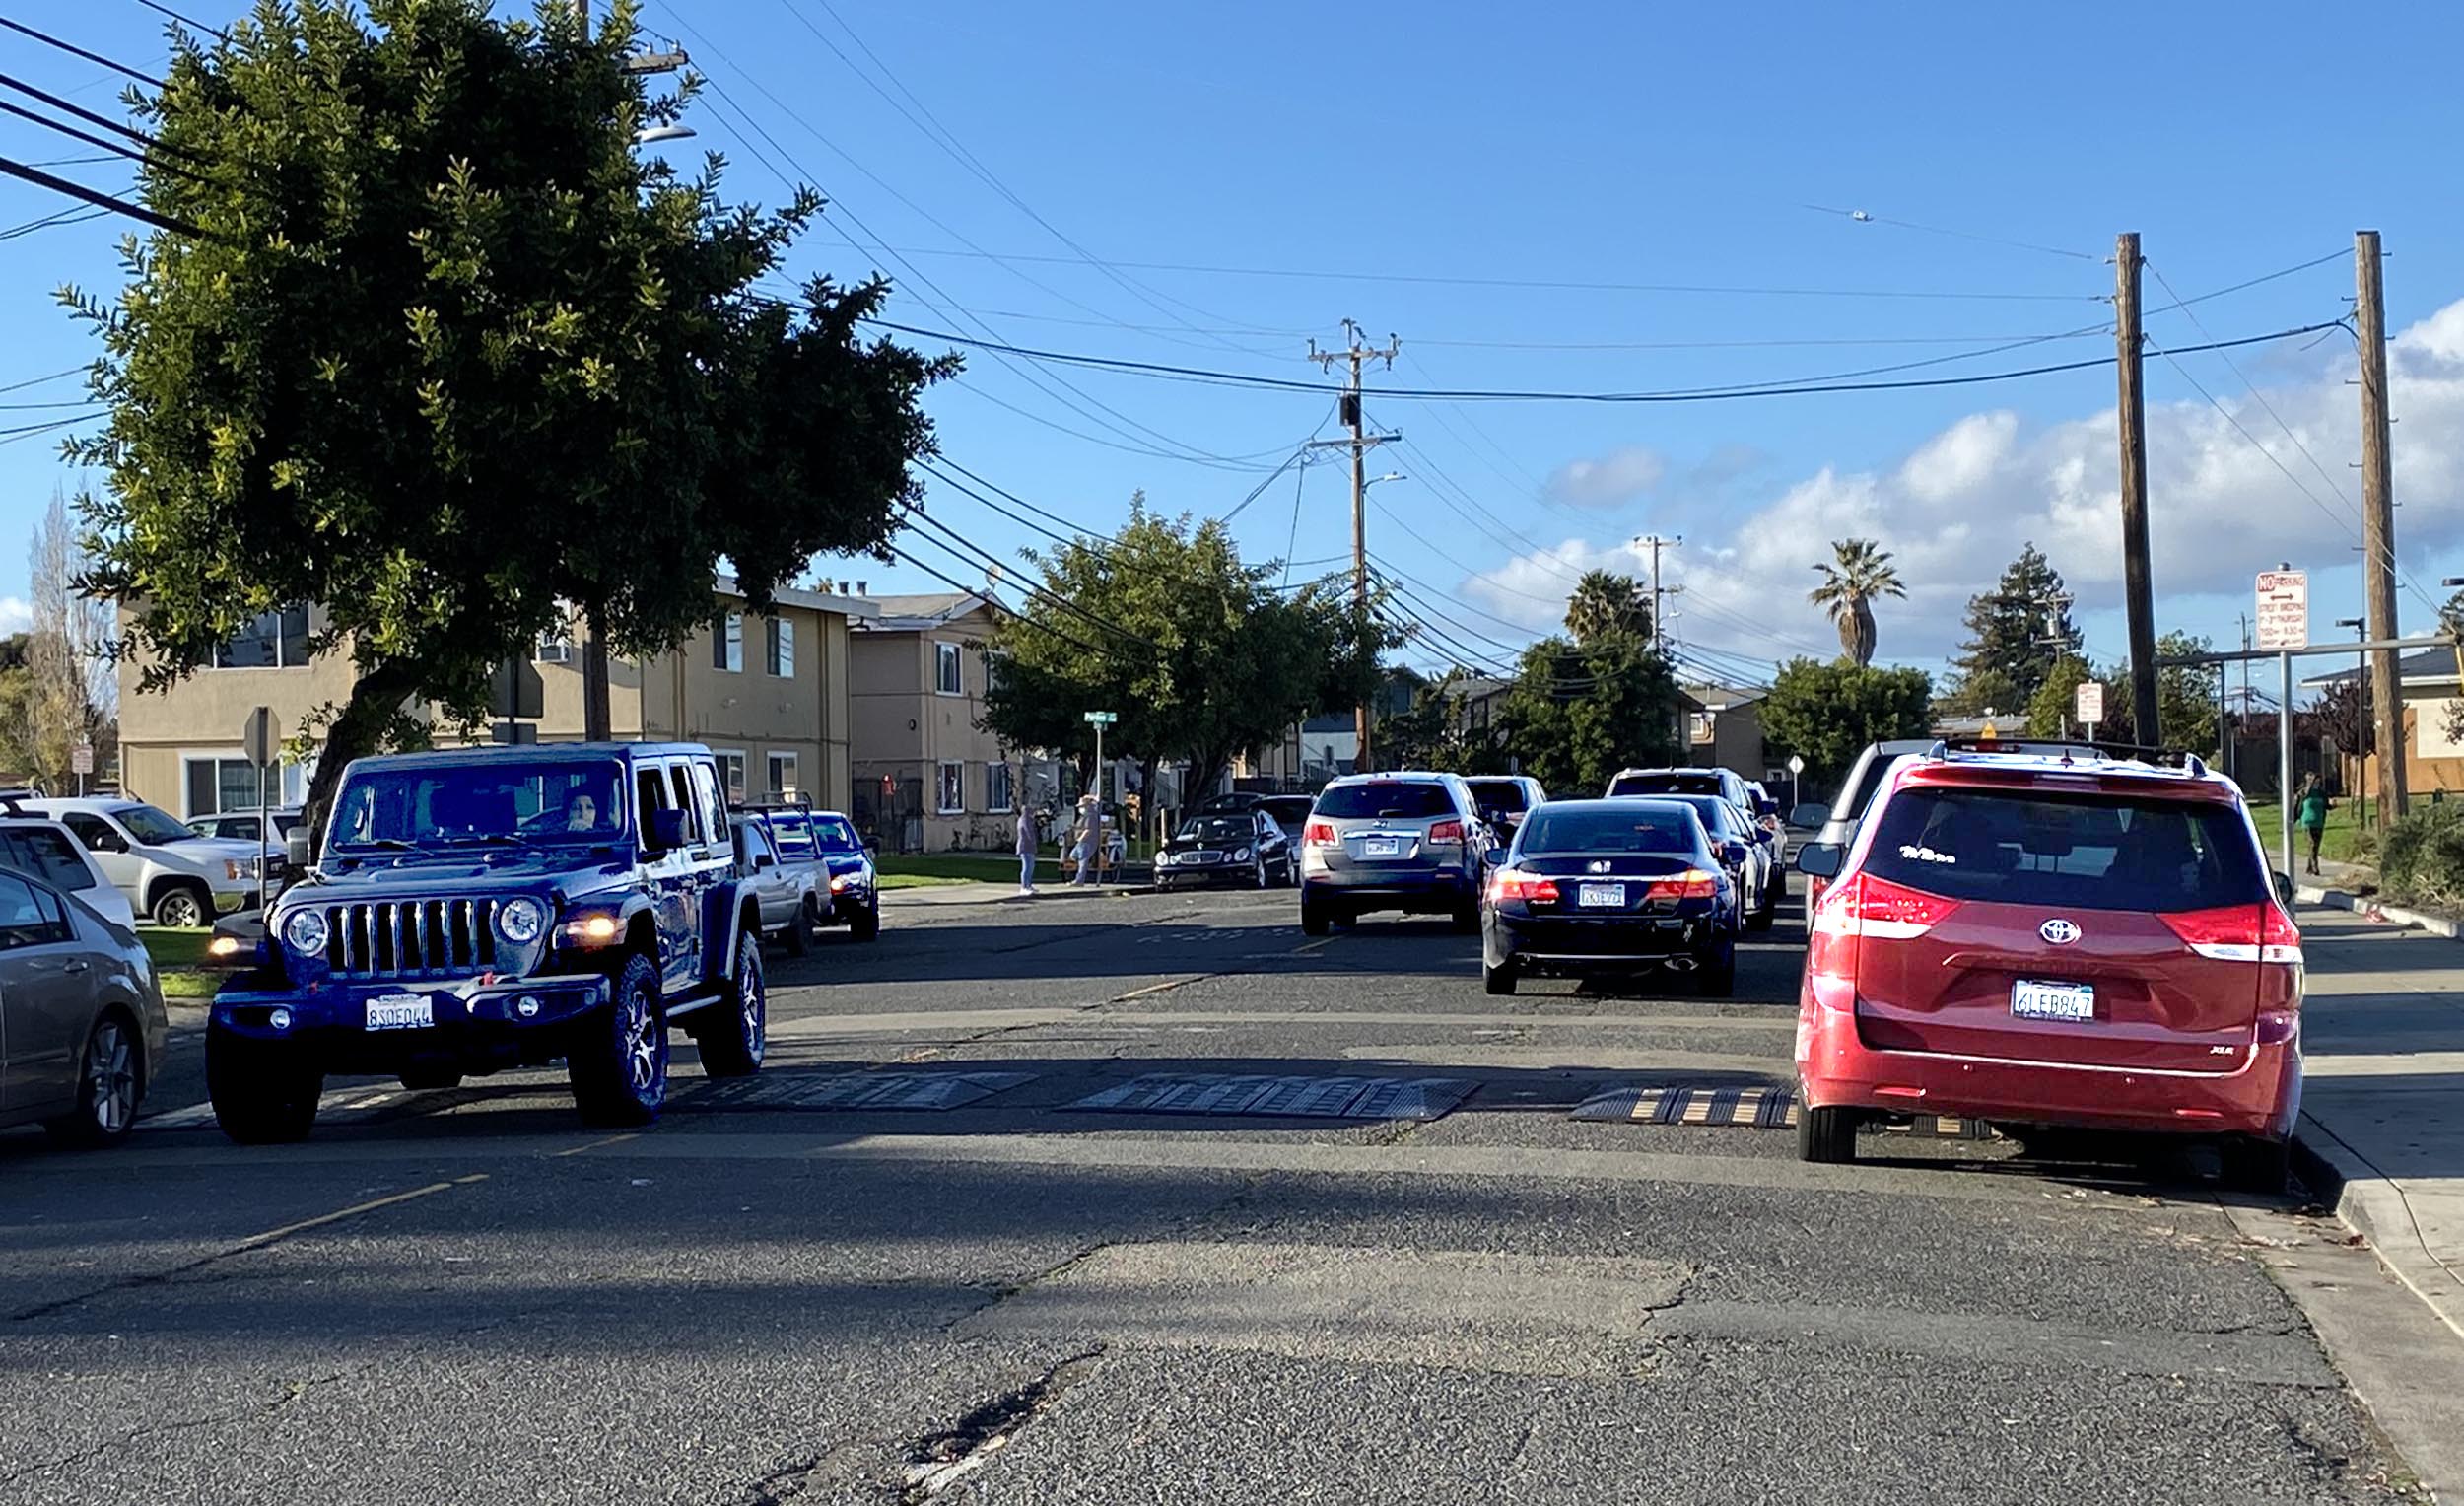
The dropping-off process usually goes more smoothly than picking up, as it doesn’t require a parent to first find the child. Plus, during pickup, some early birds have been seen queuing up in the drop-off lane as early as 45 minutes or an hour, with most cars spilling over to park along the street. Parents who arrive later see this congestion, are reluctant to enter the now full off-street parking/loading areas, and instead double-park on the street, causing safety concerns.
As shown on the maps, the nearby active schools are one and a half to three miles from the schools being closed. Given this increase in trip length of two miles each trip — a total of four trips per day (two for drop-off and two for pickup) — the approximate increase in traffic will be eight vehicle miles per student per day. Assuming 180 school days in a year, the additional annual average cost of driving per displaced student will be roughly $750, including fuel, insurance, and maintenance.
An alternative — bus transport — has its challenges. One is a current shortage of qualified and fully licensed bus drivers. Another, according to the 2021 State of School Transportation report by HopSkipDrive, is that Covid-19 has made parents anxious about putting their children on crowded buses, a trend likely to continue post-Covid. Third, financial constraints are affecting the provision and upkeep of school bus services.
School transportation has often been an afterthought in school site evaluation and selection. However, neighborhood schools were a concept as early as the 1920s, in Clarence Perry’s Neighbourhood Unit. The Neighbourhood Unit addressed head-on the ability to walk to and from schools: “Centre the school in the neighbourhood so that a child’s walk to school was only about one-quarter of a mile and no more than one-half mile and could be achieved without crossing a major arterial street.”
Integrating transportation planning with school planning is crucial, and will continue to be. Integrated planning for schools and mobility will help school district boards understand and analyze complex transportation measures such as travel time to school. (See “Why Schools need planners,” by Kelley D. Carey.)
 Dhawal Kataria, AICP, is a transportation planner with Kittelson & Associates, Oakland. He holds a master’s degree in city and regional planning from the University of Texas at Arlington and a bachelor’s in planning from the School of Planning and Architecture, Vijayawada, India. You can reach him at [email protected].