by Elizabeth Adam, May 24, 2023
The Bay Area Greenprint, a land-use decision-making webtool, has recently been updated to include features that help anyone who wants to know how their plans or proposed projects will achieve key objectives laid out in the State’s Pathways to 30×30 initiative. New modules interpret existing and updated resource data in the context of climate resilience and the State’s 30×30 goals. Projects that fulfill goals set out in the 30×30 pathway, and/or incorporate climate resilience in their planning decisions, may be more competitive for funding or approval. Author Elizabeth Adam examines how the Bay Area Greenprint’s data analysis, visualization, and reporting functions have helped planners achieve consensus and move their projects forward, and she explores how the Greenprint tool has been updated to respond to climate resilience analysis needs and California’s Pathways to 30×30 strategy.
Planners are by definition optimists. If we didn’t care how things played out, we wouldn’t bother to craft plans. General plans, regional plans, transit plans, conservation plans, and specific plans exist because planners want to make things better for a site, a city, a region, or a population. Planners are tasked with meeting the hopes and expectations of communities by creatively applying best practices while managing competing interests and solving unforeseen and complex problems.
Under the weight of so many layers of expectation and myriad practical considerations, plans must have incredible integrity of strategy and execution. This article explores how data integrity, visualization tools, and expanded reporting functions in the Bay Area Greenprint have helped planners achieve consensus and move their projects forward. We will also see how California’s Pathways to 30×30 initiative creates an opportunity to integrate new data sets and analyses into the planning process to protect critical ecological services, safeguard vulnerable communities, and protect local economies. As increased federal, state, and local funds support fighting climate change, projects that further the goals of the 30 x 30 initiative will likely receive priority funding consideration and have increased cross-sector benefits. Plans that stay relevant in an evolving natural environment and broadened cultural environment will have the biggest positive impact.
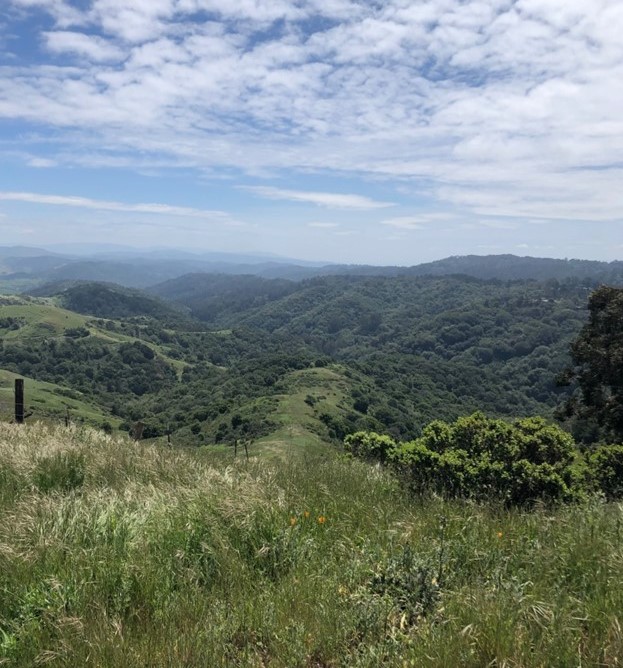
Photo Credit: Evan DiGiorgio
New realities need new tools
We all experience the consequences of climate change in California – prolonged drought, extreme wildfires, warming air and water temperatures, and increased deaths due to heat. Transportation plans become obsolete when wildfire evacuation strategies are needed. Site plans become obsolete when increased temperatures cause widespread power outages that compromise critical infrastructure. In the face of climate change, resilience is the key to keeping thoughtful, well-crafted plans from becoming prematurely obsolete.
Pathways to 30 x 30 Initiative seeks to increase resilience
In April 2022, Governor Newsom signed Nature Based Solutions Executive Order N-82-20 directing the California Department of Natural Resources to prioritize protecting 30% of California’s lands and coastal waters as a means to protect biodiversity and fight climate change. This effort is part of the worldwide campaign to do the same. However, protecting land by acreage alone will not foster the biodiversity needed to ensure healthy ecosystems and climate resilience. Where we protect land is as important as how much land is protected. Protecting biodiversity hotspots, wildlife corridors, and climate adaptation landscapes strategically will help protect California’s livability and economic success. The goals of the 30 x 30 initiative overlap with planning goals by considering common key components, including connectivity, long-term visions and near-term solutions, data integrity, and equity.
While there are many elements to consider when crafting plans, many planning efforts consider changing current land uses or introducing new land uses. Whether it is greenfield, brownfield, or restoration planning, deciding how and why to change an existing land use has short- and long-term consequences. The Bay Area Greenprint tool helps planners face these complex challenges.
An integrated picture makes the difference
“The Bay Area Greenprint carried us over the finish line by visualizing the complex range of data we needed while updating our policy on Spheres of Influence,” said Brendon Freeman of Napa LAFCO. He and Dawn Mittleman Longoria turned to the Greenprint to access information representing the multiple resource values in the landscape. Useful data they were able to attain included the CA Storie Index, a soil rating using soil characteristics that govern the land’s potential uses and agricultural capacity, as well as Napa County landscapes’ irrigation capability and watershed designations. Their Greenprint reports helped them through difficult discussions and over barriers of misinformation, finally allowing their task force to find alignment about the values of lands which helped them draft guidelines related to natural assets in their communities. They were able to use GIS as a tool to illustrate visually to stakeholders the resources and values of their land and how existing and proposed policies may impact them. “A picture really is worth a thousand words,” said Dawn, referring to how Greenprint’s maps and dashboards could easily depict local reality to stakeholders and proved invaluable in bringing everyone together around a shared view of the actual data.
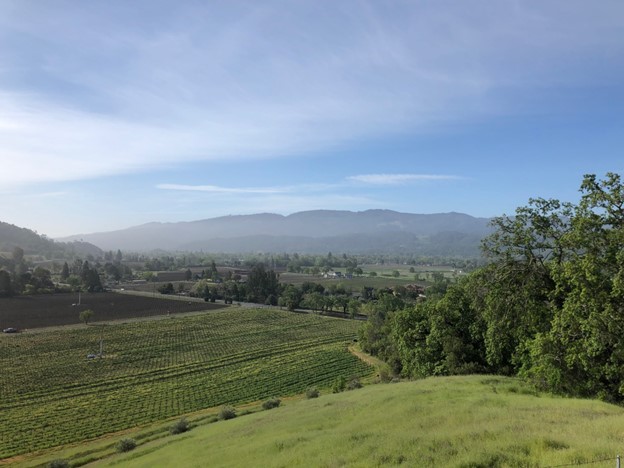
Photo Credit: Elizabeth Adam, 2023
The importance of data integrity
In 2018, the Santa Clara Valley Open Space Authority, a public, independent special district that works to protect the quality of life in Santa Clara County by preserving open space and natural resources, was given an opportunity to partner with the Peninsula Open Space Trust and the City of San José to purchase 937 acres of land in North Coyote Valley that had been threatened with industrial and warehouse development for decades. In order to complete the purchase as part of the City’s 2018 Measure T Infrastructure Bond, the team needed to make the case for open space conservation and justify the land acquisition.
The Open Space Authority had previously analyzed data and developed a conservation strategy for Coyote Valley, and it understood the Valley’s unique importance as the primary landscape linkage between the Santa Cruz and Diablo Mountain Ranges. Using the Bay Area Greenprint tool and other resources, they were able to bolster their analysis and confirm their case for conservation. Matt Freeman, Assistant General Manager of the Santa Clara Valley Open Space Authority, found the Greenprint tool’s interface easy to use. “It is interactive,” he says, “so you can explore what matters most. It has the potential to advance the pace and scale of conservation to address habitat loss and climate impacts.”
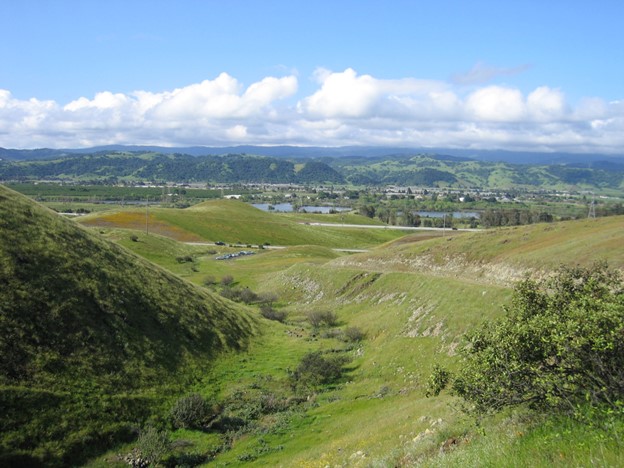
Photo Credit: Cait Hutnik
Bay Area planning looks to the future
Planning today is more data driven than ever, and data visualization is an important component of the planning process. Through data visualization, planners can explore scenarios, options, and potential impacts ahead of a major outlay of resources and more effectively communicate such information to decision makers and community members. Greenprint’s land-use decision-support tool provides Planners with visualized data on a wide range of resource values, policies, and opportunities, thereby empowering them to prioritize scenarios that maximize benefits and minimize conflicts. Using the Greenprint tool in the first stages of a planning project can also minimize the need for complex mitigation scenarios after the fact.
Shared planning goals
“We are not separate from the environment,” says Jessica Little of Together Bay Area. “Collaboration is the only answer to durable climate solutions that integrate people & land.” Because we are all part of the same system, we must collaborate across jurisdictions, across professions, and across cultures to sustain the environment that sustains us. Collaboration is essential – and it’s also complex. The benefit of the complex process, however, is that “the outcomes are more meaningful, more lasting, and at a larger scale” than siloed processes, says Little. While cross-sector collaboration may seem to add an untenable amount of complexity to an already-complex process, Greenprint can integrate and simplify policy and ecological data in a given area to create a common resource from which to work.
Powerful, accessible GIS tool
Data sets for many variables considered during planning are often available in our tech-savvy region. Traditionally, collecting and integrating varied data layers into planning activities added to the complexity of the planning process. Greenprint was designed by The Nature Conservancy, GreenInfo Network, American Farmland Trust, Together Bay Area, and Greenbelt Alliance in 2017 as a framework for land use analysis. The Greenprint tool has compiled, vetted, unified, and standardized data sets on a wide range of natural resource and policy information to provide a more complete understanding of a project site or planning area in a way that is accessible, flexible, and innovative. It helps simplify and enrich Bay Area planning at many levels.
Is this something I could use?
If there is a site you are considering, a corridor you want to connect, or a resource you want to protect, Greenprint can be a valuable resource. After drawing a polygon, entering an address, or selecting a municipal boundary, you can run reports that tap into the extensive GIS data sourced from local jurisdictions, the Conservation Lands Network, the California State Geoportal, and more than 40 others. The available data comprises over 20 million records in 80 different categories to help you understand your site’s resource values in context. You can map urban heat islands in San Jose, liquefaction susceptibility in Solano County, or Water Trail sites in San Francisco. Finding out where in a city Williamson Act lands overlay Critical Habitat Streams Policy corridors and Agricultural Lands (as seen below) may save you time and money.
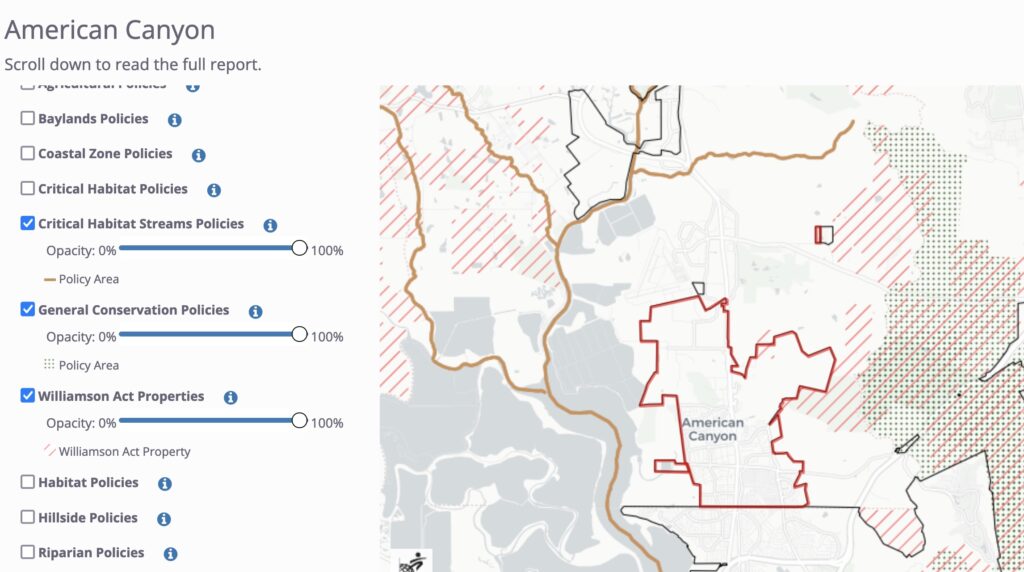
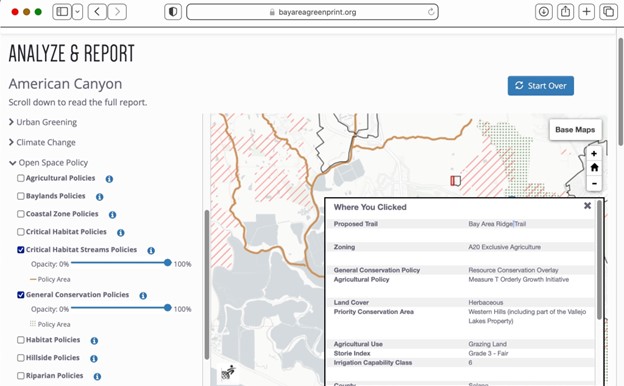
Photo Credit: Elizabeth Adam, 2023
Since 2017, the Greenprint tool has been successful at helping land use planners, conservation planners, ecological restoration practitioners, and government funders assess, analyze, and plan land use projects. Recently, the Greenprint team has incorporated both Climate Resilience and 30 x 30 modules into the web tool’s functionality to help streamline progress toward the Governor’s goal. Greenprint’s data and metrics can highlight how any area of interest may advance the objectives of California’s Pathways to 30×30 strategy, which include protecting California’s unique biodiversity; expanding equitable access to nature and its benefits; and conserving places that help California achieve carbon neutrality and/or build climate resilience. The City of Richmond is a prime example of a community that faces both ecological and community risks due to climate change, but as you can see from the Greenprint report, it also has good potential for resilience. Using the Greenprint tool’s new Resilience reporting module, you can see the city’s risks and opportunities. Below is an excerpt from a sample report for the City of Richmond generated by the Greenprint.
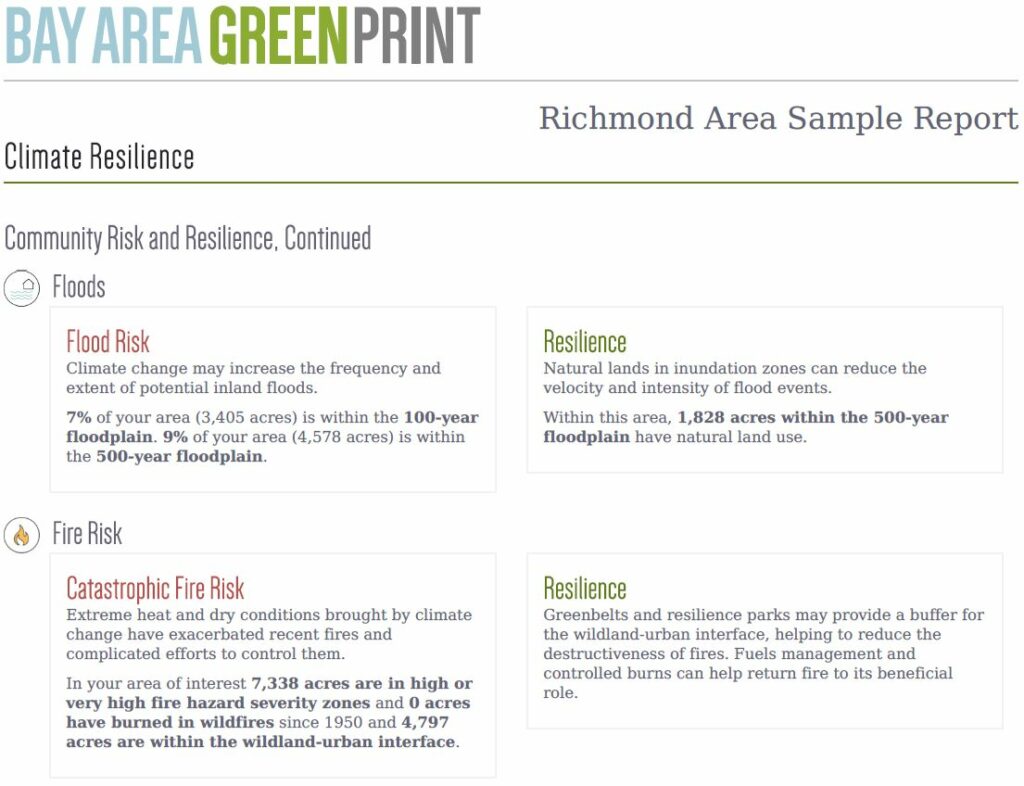
By turning on map layers within the report, Planners can see in more detail where risks and opportunities lie. With layers from Carbon Storage Potential to Tree Planting Need and Groundwater Dependent Ecosystems, gaining a deep understanding of a site and its surrounding and connecting ecosystems is easy. Many agency staff and elected leaders are motivated to incorporate conservation into infrastructure and land use planning and decision-making but lack access to data or a framework to interpret outcomes.
Planning scenarios are more complex
Increased climate risks, more complex community needs, regional housing targets, and decreasing biodiversity make planning more complex now than in the past. To stay relevant, planning projects must be examined from a variety of perspectives and consider a broader range of impacts. Serving data up easily and with strong visual components helps planners engage in more meaningful scenario planning, and potential impacts can be more efficiently considered, and more comprehensive solutions can be proposed. Alignment of Greenprint with California’s Pathways to 30×30 initiative creates an even more powerful resource for planners.
California is home to globally important biodiversity and the time is now to consider its preservation and restoration. Planning projects today set the stage for resilience and revitalization. At a minimum, a Greenprint analysis that includes multiple values allows interested stakeholders to understand and communicate across boundaries. Similarly, a Greenprint analysis can help local officials develop a coordinated strategy for guiding development to the most appropriate locations to avoid conflicts, while protecting important natural resources. Using the Greenprint will make the barrier to comparing options lower than it has ever been.
If you’d like to learn more about the Bay Area Greenprint, please visit www.BayAreaGreenprint.org or attend an upcoming workshop.
Are you inspired by this article? Share your responses to the questions below and reactions to this article by visiting the Updated Bay Area Greenprint supports climate resilience and Pathways to 30×30 objectives post at the APA California – Northern LinkedIn page.
- Are you thinking about working across disciplines? How would you go about starting that conversation?
- Are there projects that you think could benefit from analysis developed using Greenprint?
- Would reviewing data through Greenprint’s new lens shape your thinking differently? If so, how?
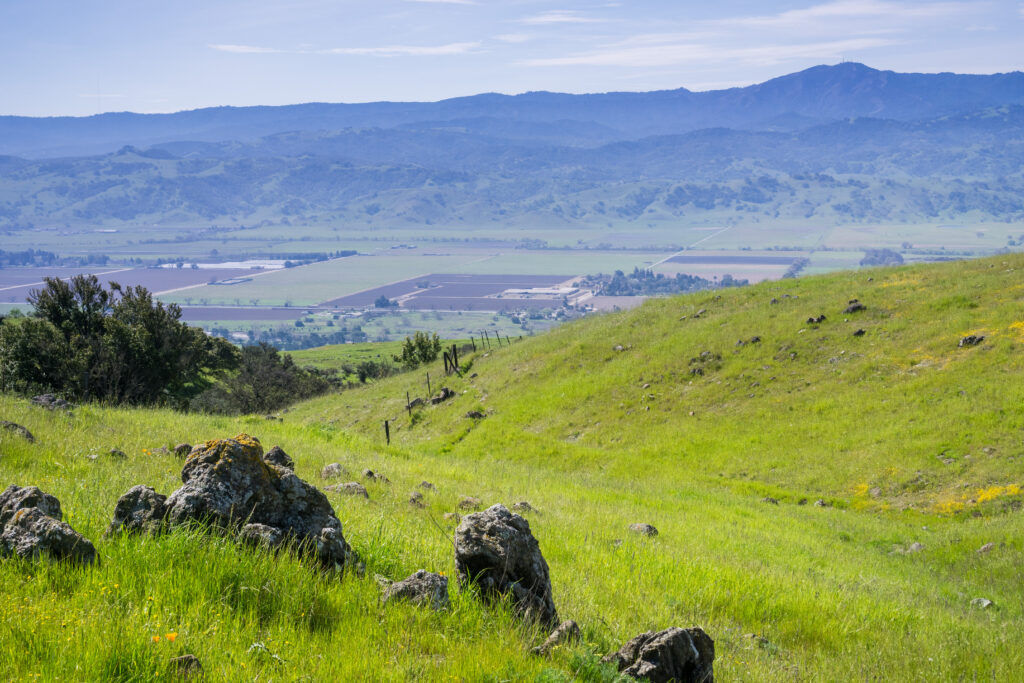
Photo credit: AdobeStock by Sundry Photography